BREAD on real EPICv2 data: vitamin C in serially passaged fibroblasts
Jaemin Park
2026-07-16
Source:vignettes/bread-vitc.Rmd
bread-vitc.RmdBiological question
Ascorbic acid (vitamin C) is a cofactor for TET dioxygenases, which oxidize 5mC → 5hmC → 5fC → 5caC and drive active DNA demethylation. TET activity is thought to protect CpG islands from aberrant age-associated hypermethylation. In serially passaged human fibroblasts, two CpG sets consistently change:
- PRC-CGI (Polycomb-marked CpG islands, H3K27me3 ∩ CGI) gain methylation with passage number;
- PMD-soloWCGW (late-replicating solo-WCGW CpGs within partially methylated domains) lose methylation with passage number.
The question the experiment asks: does VitC supplementation attenuate either signal? A conventional probe-level DMP pipeline reports significant CpGs; BREAD asks the complementary, region-centric question directly:
For each predefined feature region, what is the posterior probability that the methylation effect exceeds a biologically meaningful threshold?
The packaged data
BREAD ships a small (~0.5 MB) subset of a real EPICv2 experiment from
our lab — 8 arrays on AG06561 fetal skin fibroblasts across a 2 × 2
design (condition × passage × 2 technical replicates). The data-raw
builder is data-raw/make_vitc_extdata.R (in the source
repository).
library(BREAD)
library(SummarizedExperiment)
library(GenomicRanges)
library(ggplot2)
library(patchwork)

se  <- readRDS(system.file("extdata", "vitc_ag06561.rds", package = "BREAD"))
reg <- readRDS(system.file("extdata", "vitc_regions.rds", package = "BREAD"))
se
#> class: RangedSummarizedExperiment
#> dim: 6716 8
#> metadata(0):
#> assays(1): betas
#> rownames(6716): cg00003513 cg00004633 ... cg27639620 cg27642771
#> rowData names(7): Probe_ID CpG_Island ... H3K27AC H3K4ME3
#> colnames(8): 209725120091_R01C01 209725120091_R02C01 ...
#>   209725120091_R07C01 209725120091_R08C01
#> colData names(16): total_num batch_num ... sample_label group
as.data.frame(colData(se)[, c("condition", "passage", "replicate")])
#>                     condition passage replicate
#> 209725120091_R01C01      ctrl   early         1
#> 209725120091_R02C01      ctrl    late         1
#> 209725120091_R03C01      ctrl   early         2
#> 209725120091_R04C01      ctrl    late         2
#> 209725120091_R05C01      aa57   early         1
#> 209725120091_R06C01      aa57    late         1
#> 209725120091_R07C01      aa57   early         2
#> 209725120091_R08C01      aa57    late         2
length(reg); table(reg$feature_class)
#> [1] 500
#>
#> Active_enhancer Active_promoter        Bivalent    PMD_soloWCGW         PRC_CGI
#>             100             100             100             100             100
Five feature classes, 100 regions each, all on autosomes, each region
spanning ≥ 3 EPICv2 probes after a ±2 kb merge.
reg$feature_class will drive the
plot_feature_set() stratification below.
Aging contrast in ctrl samples
Under the ctrl condition (no VitC), BREAD should recover
the well-known aging signatures: PRC-CGI hypermethylation and
PMD-soloWCGW hypomethylation.
se_ctrl <- se[, colData(se)$condition == "ctrl"]
fit_aging <- fit_bread(
  se            = se_ctrl,
  features      = reg,
  design        = ~ passage,
  contrast      = "passagelate",
  delta         = 0.10,
  prob_cutoff   = 0.95,
  min_probes    = 3L,
  feature_class_col = "feature_class"
)
#> Loading required namespace: GenomeInfoDb
fit_aging
#> <BreadFit>
#>   mode       : summary
#>   backend    : conjugate
#>   input_scale: Beta
#>   assay      : betas
#>   contrast   : passagelate
#>   delta      : 0.1
#>   prob_cutoff: 0.95
#>   n_regions  : 500 (of  500  input)
#>   classifications:
#>     hypermethylated  76
#>     hypomethylated   39
#>     inconclusive     385
Classifications by class
mp       <- unique(fit_aging@mapping[, c("region_id", "feature_class")])
res_a    <- merge(results(fit_aging)[, c("region_id", "classification")],
                  mp, by = "region_id")
table(res_a$feature_class, res_a$classification)
#>
#>                   hypermethylated hypomethylated inconclusive
#>   Active_enhancer              21              4           75
#>   Active_promoter               7              0           93
#>   Bivalent                     20              2           78
#>   PMD_soloWCGW                 13             30           57
#>   PRC_CGI                      15              3           82
As expected: - PRC-CGI and Bivalent regions skew
strongly toward hypermethylated with passage. -
PMD-soloWCGW regions skew strongly toward
hypomethylated. - Active promoters and
active enhancers are largely inconclusive
with this sample size (n = 2 per passage), consistent with the weaker
direct effect at those regulatory elements.
Bird’s-eye plot
plot_feature_set(fit_aging, feature_class_col = "feature_class") +
  ggtitle("Aging (late vs early), ctrl samples")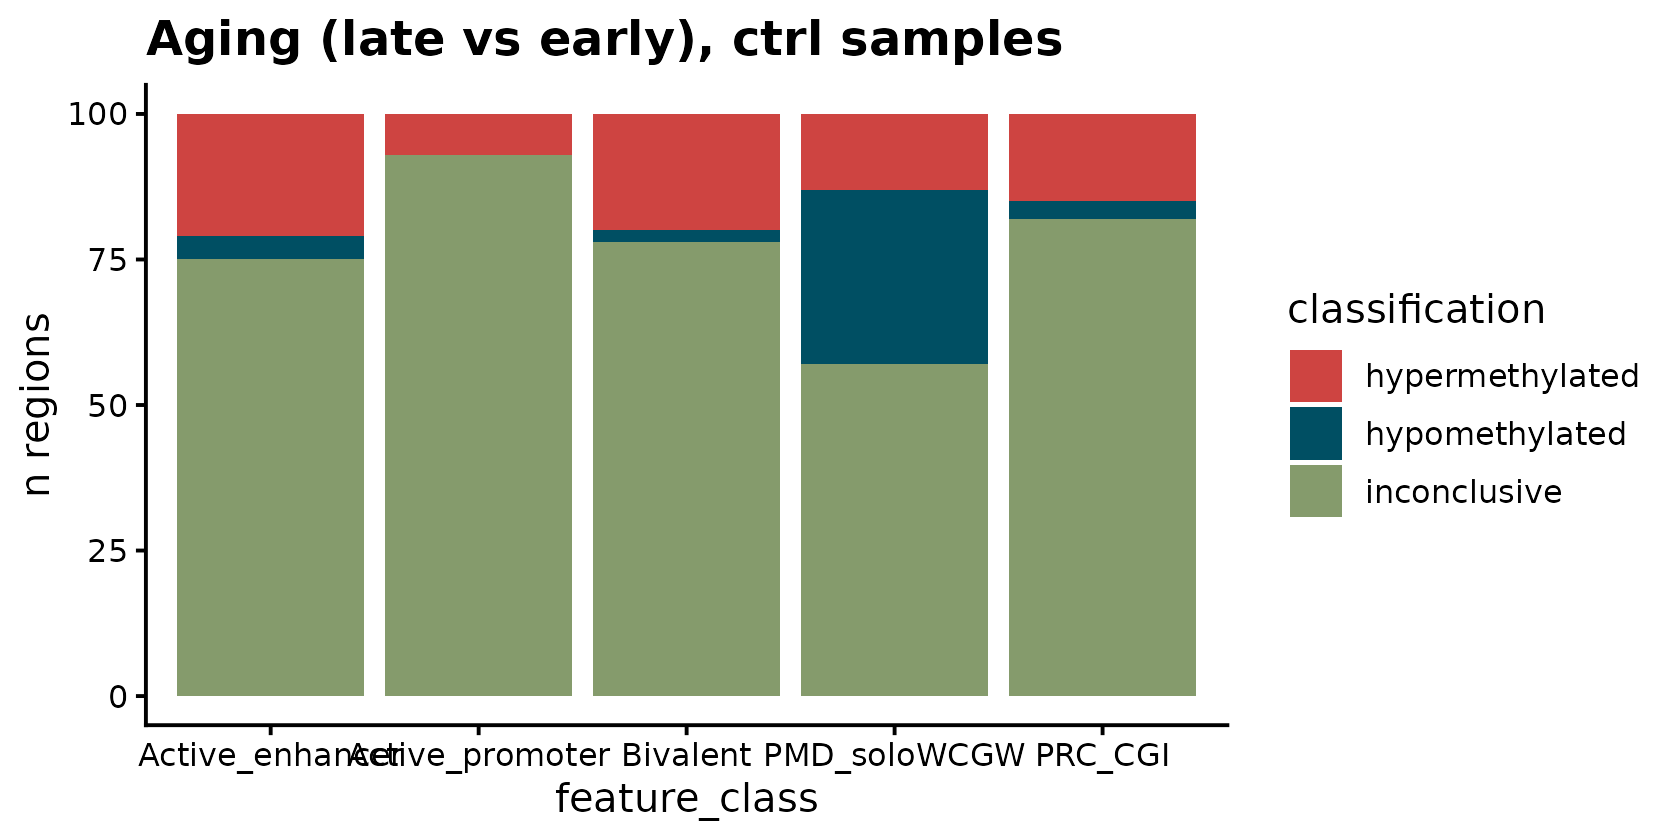
VitC contrast at late passage
Now condition on late passage and test whether ascorbic acid supplementation demethylates any regions.
se_late <- se[, colData(se)$passage == "late"]
fit_vitc <- fit_bread(
  se            = se_late,
  features      = reg,
  design        = ~ condition,
  contrast      = "conditionaa57",
  delta         = 0.10,
  prob_cutoff   = 0.95,
  min_probes    = 3L,
  feature_class_col = "feature_class"
)
fit_vitc
#> <BreadFit>
#>   mode       : summary
#>   backend    : conjugate
#>   input_scale: Beta
#>   assay      : betas
#>   contrast   : conditionaa57
#>   delta      : 0.1
#>   prob_cutoff: 0.95
#>   n_regions  : 500 (of  500  input)
#>   classifications:
#>     hypermethylated  5
#>     hypomethylated   34
#>     inconclusive     461
res_v <- merge(results(fit_vitc)[, c("region_id", "classification")],
               mp, by = "region_id")
table(res_v$feature_class, res_v$classification)
#>
#>                   hypermethylated hypomethylated inconclusive
#>   Active_enhancer               0             10           90
#>   Active_promoter               0              5           95
#>   Bivalent                      0              7           93
#>   PMD_soloWCGW                  5             10           85
#>   PRC_CGI                       0              2           98
plot_feature_set(fit_vitc, feature_class_col = "feature_class") +
  ggtitle("VitC (aa57 vs ctrl), late passage")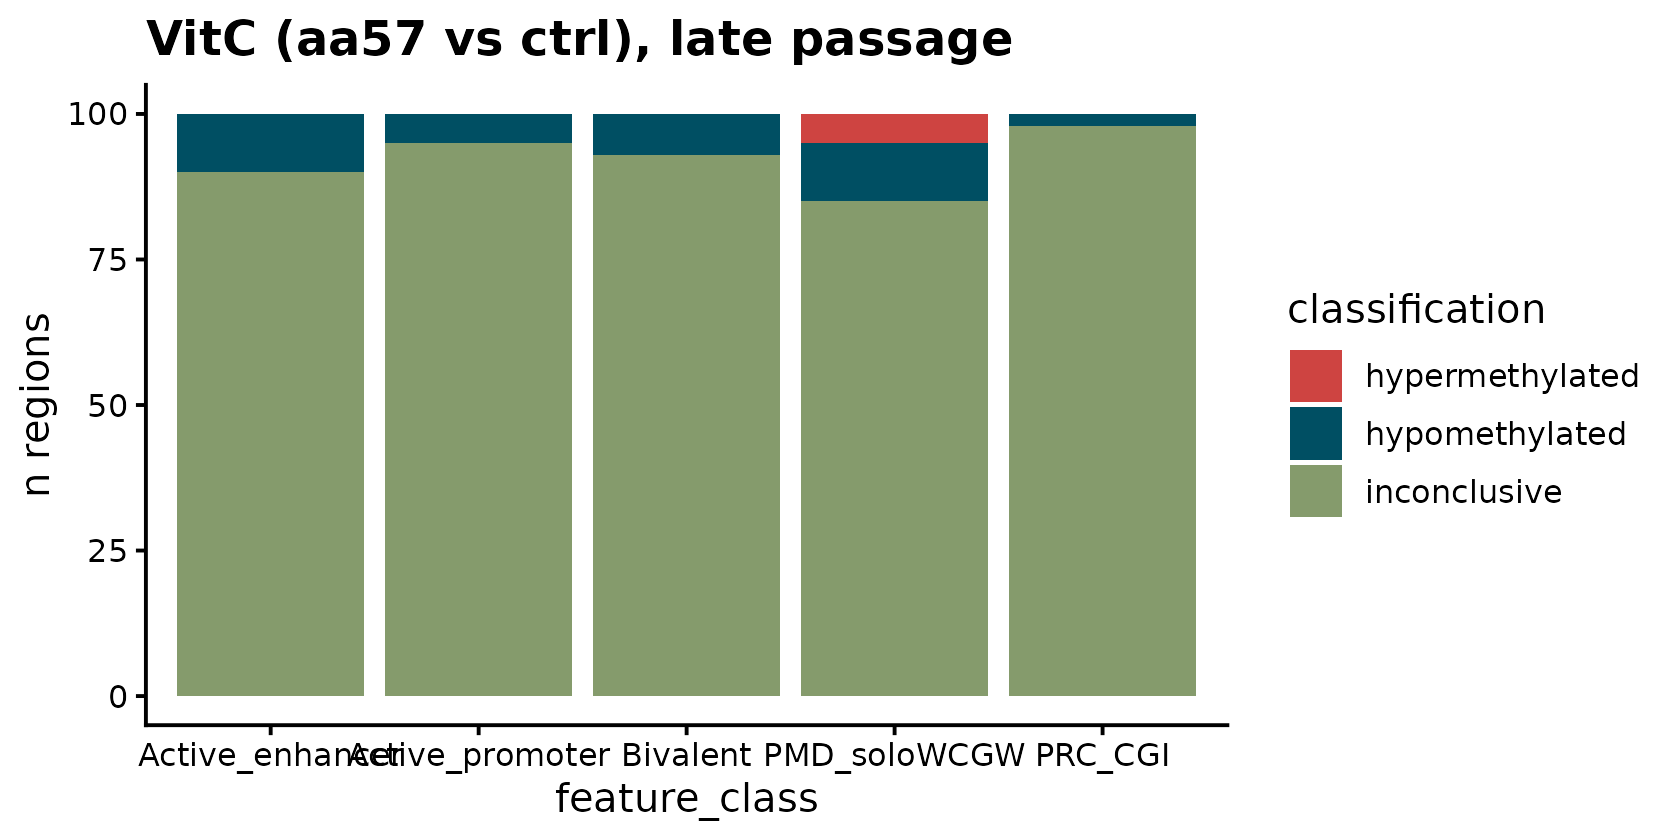
VitC demethylation is broadly distributed but, with only two
replicates per arm, most regions land in the inconclusive
class at prob_cutoff = 0.95. This is BREAD doing its job —
it does not claim more certainty than the sample size supports.
The biologically interesting intersection
The most interpretable cross-tab is aging × VitC: which regions that hypermethylate with aging are demethylated by vitamin C?
a <- classifications(fit_aging)
v <- classifications(fit_vitc)
common <- intersect(names(a), names(v))
xt <- table(aging = a[common], vitc = v[common])
xt
#>                  vitc
#> aging             hypermethylated hypomethylated inconclusive
#>   hypermethylated               0             17           59
#>   hypomethylated                4              2           33
#>   inconclusive                  1             15          369
The aging-hyper ∩ VitC-hypo cell contains the candidate VitC-responsive aging hypermethylation regions — the mechanistic story the project is chasing.
protected <- names(a)[a == "hypermethylated" & v == "hypomethylated"]
length(protected)
#> [1] 17
# Feature-class composition of the protected set
table(mp$feature_class[mp$region_id %in% protected])
#>
#> Active_enhancer Active_promoter        Bivalent    PMD_soloWCGW         PRC_CGI
#>               4               1               6               5               1
The protected set is enriched in PRC-CGI / Bivalent regions — consistent with vitamin C’s known role as a CpG-island guardian via TET recruitment.
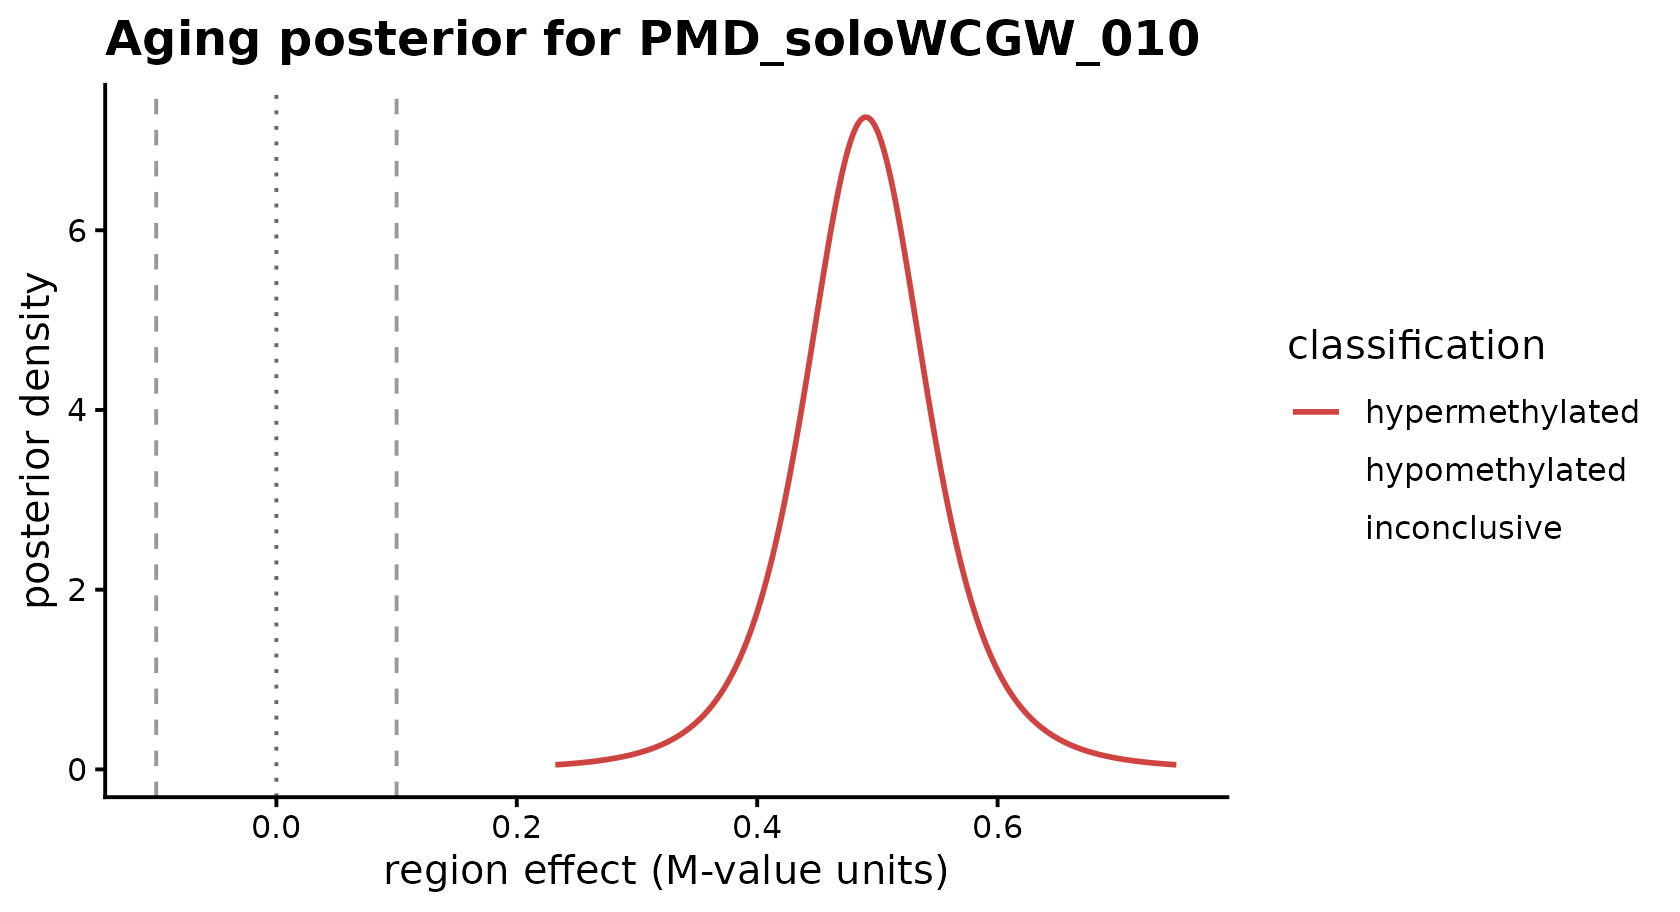
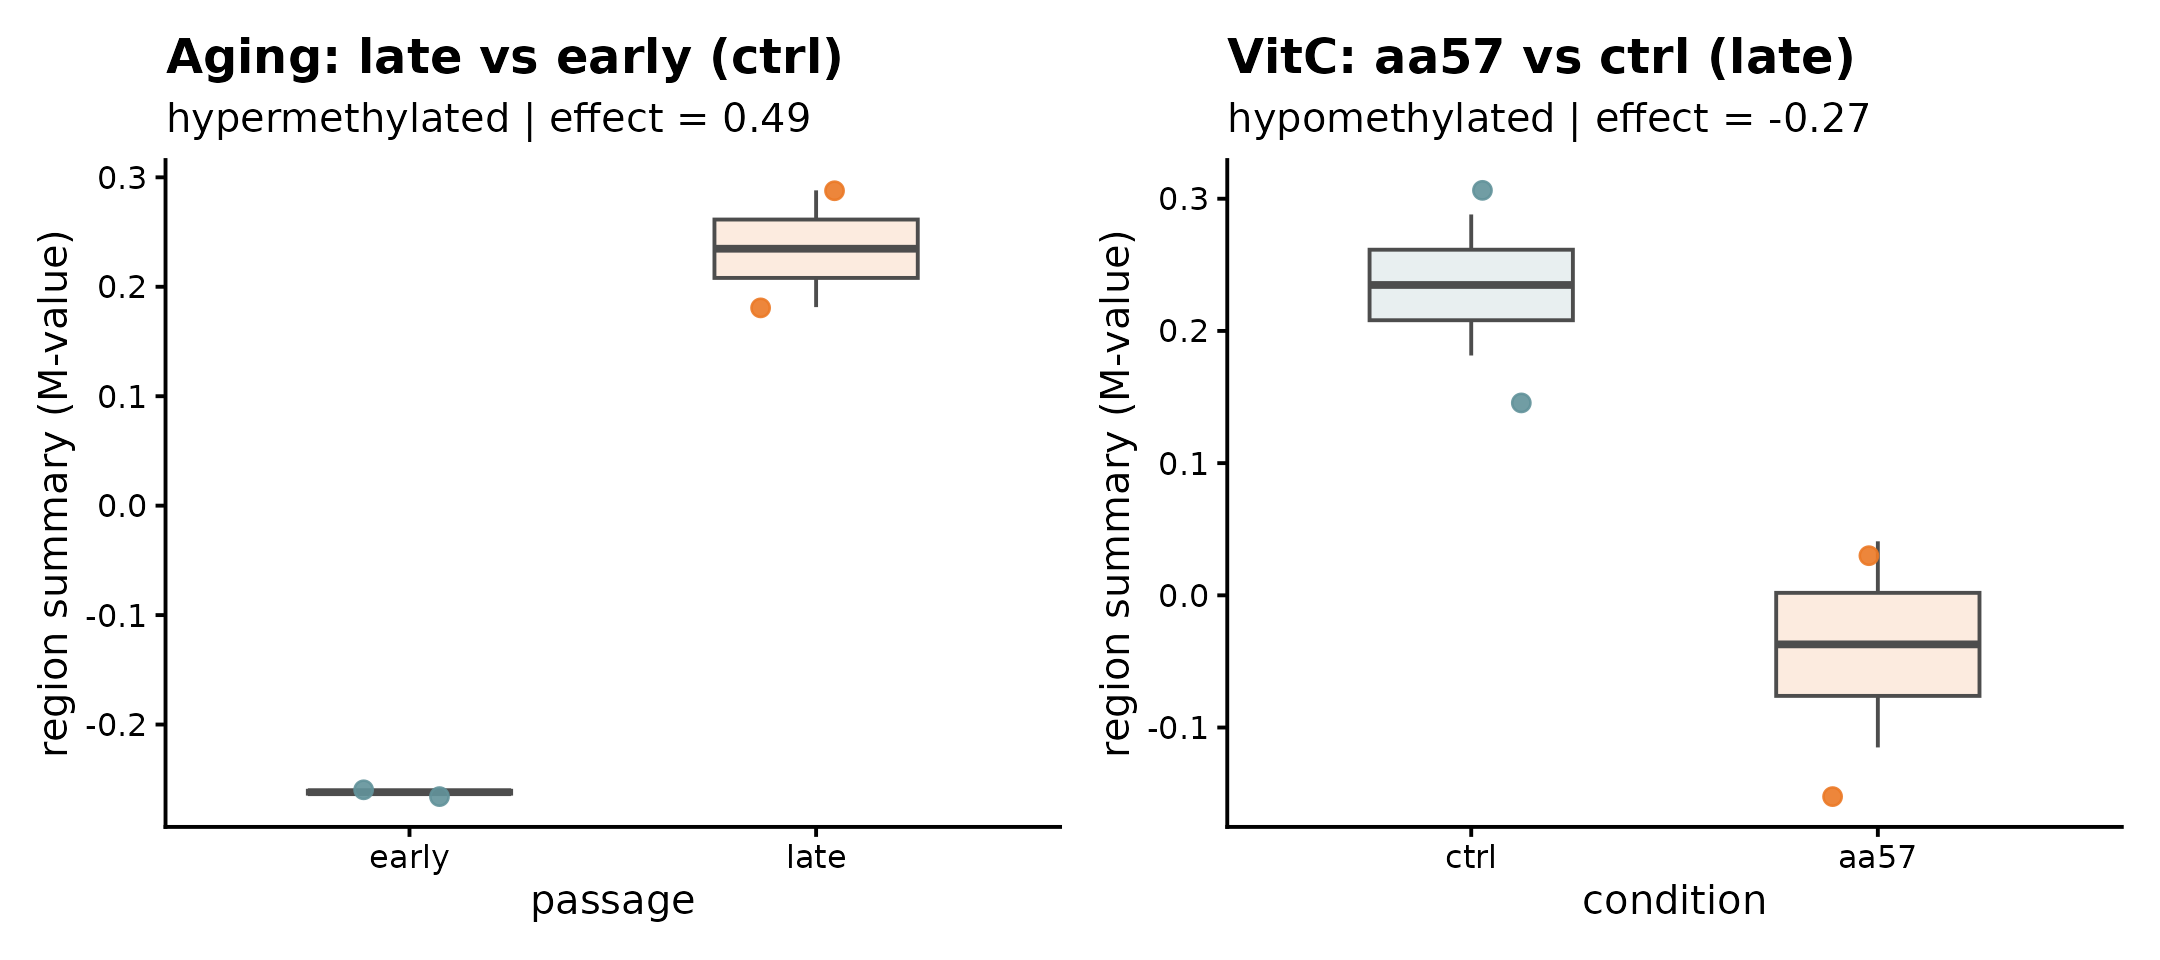
Zooming in on one region
if (length(protected) > 0L) {
  rid <- protected[1]
  rid
  plot_region_posterior(fit_aging, region_id = rid) +
    ggtitle(sprintf("Aging posterior for %s", rid))
}
if (length(protected) > 0L) {
  rid <- protected[1]
  p_aging <- plot_region_data(fit_aging, rid) +
    ggtitle("Aging: late vs early (ctrl)")
  p_vitc  <- plot_region_data(fit_vitc,  rid) +
    ggtitle("VitC: aa57 vs ctrl (late)")
  p_aging + p_vitc
}
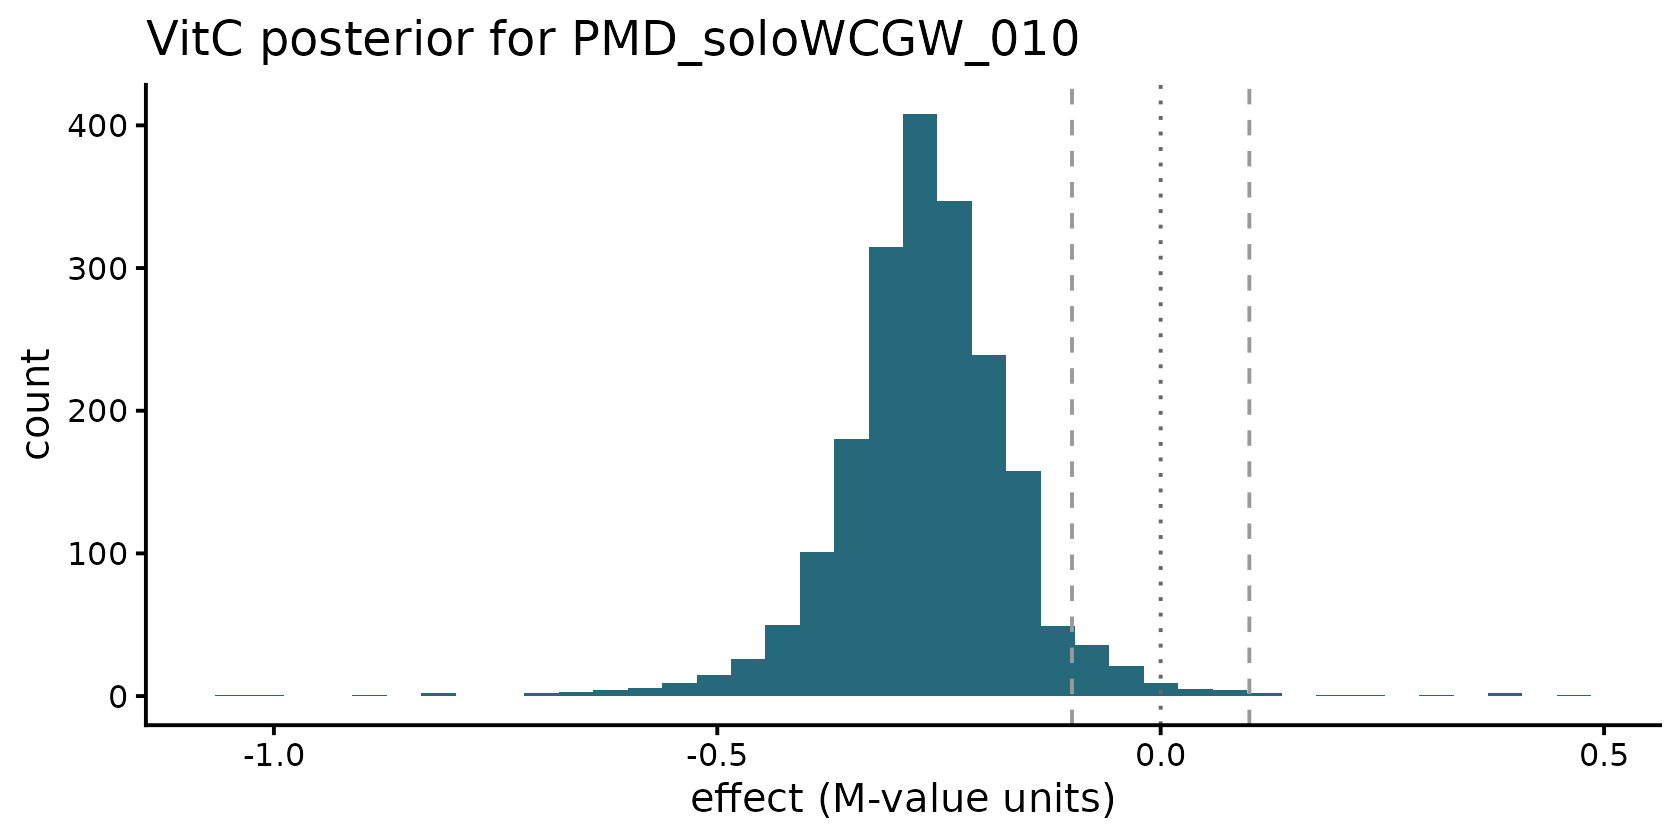
if (length(protected) > 0L) {
  rid <- protected[1]
  d <- posterior_draws(fit_vitc, region_id = rid, n = 2000L, seed = 1L)
  ggplot(d, aes(x = value)) +
    geom_histogram(fill = bread_colors("classification")[["hypomethylated"]],
                   bins = 40, alpha = 0.85) +
    geom_vline(xintercept = c(-0.10, 0, 0.10),
               linetype = c("dashed","dotted","dashed"),
               color = c("gray60","gray40","gray60")) +
    labs(title = sprintf("VitC posterior for %s", rid),
         x = "effect (M-value units)", y = "count") +
    theme_classic(base_size = 12)
}
Caveats
-
n = 2 per arm. The credible intervals are wide and
many regions remain
inconclusive. BREAD’s posterior probabilities are the honest answer given the data; loweringprob_cutoffto, say,0.80will promote more regions tohyper/hypobut also admit more false positives. - Technical replicates, not biological. Real variance in the
aa57effect across fibroblast lines is not captured by this experiment and would produce additional dispersion if included. - Feature-class regions here are constructed from the EPICv2 manifest’s probe-level annotations (CGI, PMD, histone marks) by merging nearby annotated probes. Users should consider higher-resolution external references (ENCODE chromHMM, segway, compartment-aware WGBS-derived PMD calls) when the question demands it.
Session info
sessionInfo()
#> R version 4.6.1 (2026-06-24)
#> Platform: x86_64-pc-linux-gnu
#> Running under: Ubuntu 24.04.4 LTS
#>
#> Matrix products: default
#> BLAS:   /usr/lib/x86_64-linux-gnu/openblas-pthread/libblas.so.3
#> LAPACK: /usr/lib/x86_64-linux-gnu/openblas-pthread/libopenblasp-r0.3.26.so;  LAPACK version 3.12.0
#>
#> locale:
#>  [1] LC_CTYPE=C.UTF-8       LC_NUMERIC=C           LC_TIME=C.UTF-8
#>  [4] LC_COLLATE=C.UTF-8     LC_MONETARY=C.UTF-8    LC_MESSAGES=C.UTF-8
#>  [7] LC_PAPER=C.UTF-8       LC_NAME=C              LC_ADDRESS=C
#> [10] LC_TELEPHONE=C         LC_MEASUREMENT=C.UTF-8 LC_IDENTIFICATION=C
#>
#> time zone: UTC
#> tzcode source: system (glibc)
#>
#> attached base packages:
#> [1] stats4    stats     graphics  grDevices utils     datasets  methods
#> [8] base
#>
#> other attached packages:
#>  [1] patchwork_1.3.2             ggplot2_4.0.3
#>  [3] SummarizedExperiment_1.42.0 Biobase_2.72.0
#>  [5] GenomicRanges_1.64.0        Seqinfo_1.2.0
#>  [7] IRanges_2.46.0              S4Vectors_0.50.1
#>  [9] BiocGenerics_0.58.1         generics_0.1.4
#> [11] MatrixGenerics_1.24.0       matrixStats_1.5.0
#> [13] BREAD_0.0.0.9000
#>
#> loaded via a namespace (and not attached):
#>  [1] sass_0.4.10         SparseArray_1.12.2  lattice_0.22-9
#>  [4] magrittr_2.0.5      digest_0.6.39       evaluate_1.0.5
#>  [7] grid_4.6.1          RColorBrewer_1.1-3  fastmap_1.2.0
#> [10] jsonlite_2.0.0      Matrix_1.7-5        GenomeInfoDb_1.48.0
#> [13] httr_1.4.8          UCSC.utils_1.8.0    scales_1.4.0
#> [16] textshaping_1.0.5   jquerylib_0.1.4     abind_1.4-8
#> [19] cli_3.6.6           rlang_1.3.0         XVector_0.52.0
#> [22] withr_3.0.3         cachem_1.1.0        DelayedArray_0.38.2
#> [25] yaml_2.3.12         otel_0.2.0          S4Arrays_1.12.0
#> [28] tools_4.6.1         dplyr_1.2.1         vctrs_0.7.3
#> [31] R6_2.6.1            lifecycle_1.0.5     fs_2.1.0
#> [34] ragg_1.5.2          pkgconfig_2.0.3     desc_1.4.3
#> [37] pillar_1.11.1       pkgdown_2.2.1       bslib_0.11.0
#> [40] gtable_0.3.6        glue_1.8.1          systemfonts_1.3.2
#> [43] tidyselect_1.2.1    tibble_3.3.1        xfun_0.60
#> [46] knitr_1.51          dichromat_2.0-0.1   farver_2.1.2
#> [49] htmltools_0.5.9     labeling_0.4.3      rmarkdown_2.31
#> [52] compiler_4.6.1      S7_0.2.2